CS2 Predictor: Machine Learning for Counter-Strike 2 Match Prediction
Overview
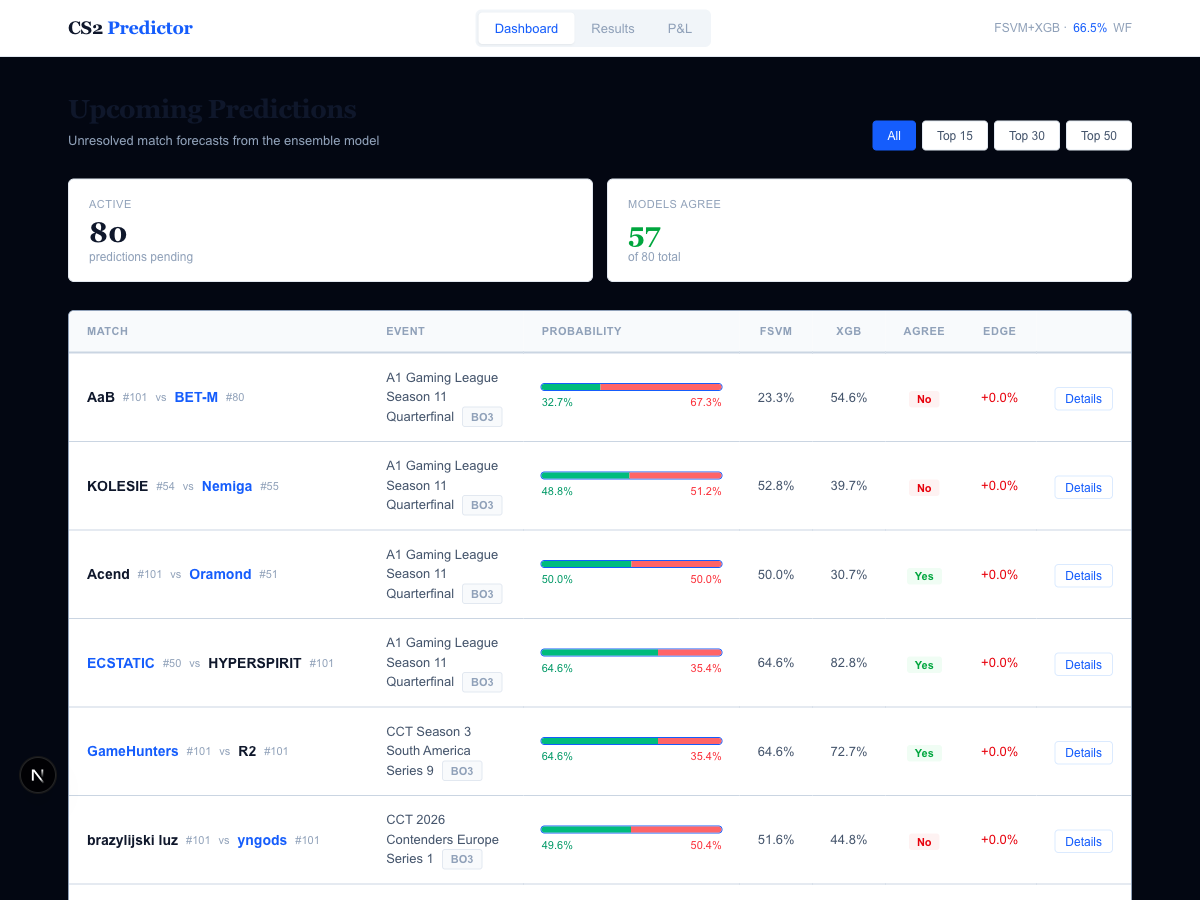
CS2 Predictor is a machine learning system that predicts professional Counter-Strike 2 match outcomes using a hybrid Fuzzy Support Vector Machine (FSVM) + XGBoost ensemble. The system scrapes match data from HLTV.org, engineers 47 features across eight statistical tracking domains, and evaluates predictions using strict walk-forward validation.
The project achieves 66.50% walk-forward accuracy with a +6.55% edge over a rank-only baseline — statistically significant at the 95% confidence level (bootstrap CI: [64.5%, 68.5%]). Throughout this writeup, edge refers to the percentage-point improvement in accuracy over the naive rank baseline (i.e., always predicting the higher-ranked team to win). A positive edge means the model is extracting predictive signal beyond what team ranking alone provides.
Motivation & Background
This project draws inspiration from the approach outlined in "Machine learning approaches to predict basketball game outcome" (Horvat & Job, 2018), published in the International Journal of Computer Science in Sport, which systematically reviews ML techniques for sports outcome prediction. The paper highlights how SVMs and ensemble methods can outperform traditional statistical models when provided with sufficiently rich feature sets — particularly when temporal patterns and team dynamics are captured. In particular we borrow the approach using a Fuzzy Support Vector Machine (which introduces fuzzy membership of inputs, which ultimately allows for more flexible class membership weighting — which becomes particularly useful for solving a SVM problem with multiple dimensions and bases, like esports data.) Original Paper: https://ieeexplore.ieee.org/document/991432
CS2 esports presents a uniquely data-rich environment for applying these ideas. Unlike traditional sports with seasonal schedules and limited games, professional CS2 teams compete in dozens of matches per month across international tournaments. HLTV.org — the definitive stat tracker for competitive Counter-Strike — provides granular data at the player, map, and round level. This created an opportunity to build feature sets far richer than what's typically available in traditional sports prediction: per-player kill/death ratios, ADR (average damage per round), KAST percentages, pistol round win rates, map pool depth, veto patterns, and more.
The core insight from the basketball prediction literature — that ensemble methods combining complementary model strengths outperform any single model — proved directly applicable. FSVM and XGBoost exhibit deeply complementary error patterns in CS2 prediction, which the ensemble exploits.
The Dataset
All data was scraped from HLTV.org across multiple scraping phases using Playwright and Chrome DevTools Protocol (CDP) to bypass Cloudflare protections.
| Dataset | Records | Coverage |
|---|---|---|
| Match results | 6,000 | All top-100 team matches |
| Match detail pages | 6,000 | 100% |
| Player statistics | 74,979 | 4,839 unique players |
| Map-level player stats | 133,470 | Per-map breakdowns |
| Half scores | 7,296 | CT/T side splits |
| Veto data | 15,858 | Map pick/ban sequences |
| Pistol round results | 3,808 | Round 1 & 13 outcomes |
| Rankings history | 2,907 | 29 weekly snapshots (Jul 2025 - Feb 2026) |
| Map results | 3,818 | From 1,608 matches |
From this raw data, we engineer a set of derived features eight real-time statistical trackers that replay the full match history chronologically to reconstruct the state of the competitive landscape at any point in time:
- Elo System (K=32) — Dynamic rating with momentum tracking
- Form Tracker — 10-match rolling win rate and streaks
- Head-to-Head Tracker — Historical matchup records
- Player Stats Tracker — Per-player rolling K/D, ADR, KAST, rating (10-match window)
- Map Stats Tracker — Map pool depth and win rates (20-match window)
- Pistol Tracker — Pistol round win rates (30-match window)
- Chemistry Tracker — Pairwise roster tenure (days played together)
- Upset Detector — Internal logistic regression predicting P(upset), retrained every 100 matches
The player and individual team performances can be depenendent on recent form, team chemistry, play/team momentum and many other factors - which we construct in the above feature set.
Feature Engineering
The richness of available CS2 data enabled a 47-feature "lean" set organized across several domains:
| Domain | Features | Examples |
|---|---|---|
| Elo & Ranking | 8 | elo_diff, rank_diff, dyn_rank_diff, log_rank_ratio |
| Form & Momentum | 3 | form_diff, momentum_diff, vs_strong_diff |
| Head-to-Head | 2 | h2h_winrate, h2h_matches |
| Map Pool | 2 | map_pool_depth_diff, map_wr_overlap |
| Rank Volatility | 5 | rank_vol_diff, rank_trajectory_diff, rank_confidence |
| Player Stats | 11 | diff_avg_rating, diff_avg_adr, diff_avg_kast, diff_chemistry, diff_roster_exp |
| Match Format | 4 | is_bo1, is_bo3, is_bo5, home_diff |
| Interactions | 6 | rank_diff_x_bo, elo_diff_x_form, momentum_x_form |
| Advanced | 4 | upset_prob, upset_prob_x_rank_diff, map_upset_potential, pistol_wr_diff |
The single largest accuracy gain in the project (+1.36 percentage points) came from expanding player data coverage from 27% to 94% of matches in Iteration 14. Features like roster experience and team chemistry — which had been defaulting to zero for most matches — suddenly became top SHAP features in model disagreement analysis. This underscores how critical data completeness is: the same features went from useless to dominant simply by filling in missing values with real data.
Model Architecture
Fuzzy SVM
The Fuzzy SVM is based on the formulation by Lin & Wang (2002), which extends the standard SVM by assigning each training sample a membership value s_i in (0, 1]:
minimize (1/2)||w||^2 + C * SUM(s_i * xi_i)
where xi_i is the slack variable for sample i and s_i controls how much that sample's misclassification penalty contributes to the objective. Samples with low membership are effectively treated as less important — their constraint violations cost less. This is implemented via scikit-learn's SVC.fit(sample_weight=s), using an RBF kernel (C=1.0, gamma='scale').
Four membership strategies were implemented and evaluated:
- Time decay:
s_i = exp(-lambda * age)— recent matches weighted exponentially higher (lambda=0.001,sigma_floor=0.1) - Class center:
s_i = 1 - (d_i / max(d))— distance from class centroid in feature space - Confidence: KNN-based entropy — ambiguous samples near the decision boundary down-weighted
- Hybrid:
s_i = s_time * s_center— multiplicative combination (alpha=0.5)
The time decay strategy proved most effective, achieving 65.50% walk-forward accuracy — the best single-model result. This aligns with the intuition that CS2's competitive landscape shifts rapidly as teams roster-swap, change form, and adapt to meta shifts. Older matches become less predictive over time. Critically, FSVM with time decay also exhibited the lowest temporal variance of any model tested (window std: 2.14%), meaning its predictions are the most stable across different time periods.
FSVM configuration: C=1.0, kernel='rbf', gamma='scale', lambda_decay=0.001, sigma_floor=0.1
XGBoost
A gradient-boosted tree ensemble with regularization:
max_depth=5, learning_rate=0.01, n_estimators=200
colsample_bytree=0.8, subsample=0.8
Walk-forward accuracy: 64.86% (+4.91% edge). Notably, XGBoost exhibited a negative train-WF gap (-1.75%) — its walk-forward accuracy exceeded its mean training accuracy — indicating strong generalization rather than memorization. Deeper tree variants (depth 10, 15, 20) were explored in Iterations 12-13 and improved test-split accuracy by up to +1.83pp, but provided negligible walk-forward improvement (+0.05pp), confirming they overfit to temporal patterns that don't generalize forward. The grid search correctly identified max_depth=5 as optimal.
Additional external sample weighting (decay=0.985) further prioritizes recent matches during training for both models.
Ensemble: Agreement-Boosted Blend
Confusion matrix analysis revealed deeply complementary error patterns between the two models:
| Scenario | FSVM Accuracy | XGB Accuracy |
|---|---|---|
| Expected outcomes (favorite wins) | 80.0% | 74.7% |
| Upsets (underdog wins) | 29.7% | 40.6% |
| Large rank gaps (30-60 diff) | 69.2% | 65.1% |
| BO3 format | 65.9% | 64.6% |
| BO1 / BO5 format | Lower | Higher |
| Low-confidence predictions | 56.1% | 53.9% |
| High-confidence predictions | Lower | Higher |
| Both models agree (79.5% of matches) | 75.4% | — |
FSVM dominates on predictable, expected outcomes — when the favorite wins, especially with large rank gaps in BO3 format. XGBoost dominates on upsets and high-confidence edge cases. The models agree 79.5% of the time (349 of 439 test samples), and when they agree, accuracy jumps to 75.4%.
The production ensemble uses an agreement-boosted strategy:
- When both models agree on the winner: trust the prediction (use FSVM's probability)
- When they disagree: blend probabilities at
0.7 * FSVM_prob + 0.3 * XGB_prob
This achieves 66.50% walk-forward accuracy with +6.55% edge — the best result across all 19 iterations.
The Upset Problem
CS2 has a high inherent upset rate: approximately 39% of matches are won by the lower-ranked team. This creates a hard ceiling on any rank-based prediction strategy — a naive "always pick the favorite" approach caps out around 61%.
The model's approach to upsets is layered. The internal Upset Detector — a logistic regression (C=0.1) trained on non-rank features and retrained every 100 matches (minimum 200 samples) — generates an upset_prob feature that feeds into both main models. SHAP disagreement analysis shows upset_prob as a top feature for XGBoost in both correct and incorrect disagreements, suggesting the model uses it as a meaningful signal even if it can't perfectly discriminate. XGBoost correctly predicts 40.6% of upsets versus FSVM's 29.7% — a meaningful gap given the difficulty of the task.
Evaluation: Walk-Forward Validation
All accuracy numbers use strict walk-forward validation — the gold standard for time-series prediction:
- Window size: 200 matches
- Start index: 3,600 (allowing tracker warmup on earlier data)
- Test samples: 2,200
- Method: Train on all data up to time t, predict the next match, advance by 1, repeat
- Bootstrap CIs: 10,000 resamples
This prevents any future information from leaking into predictions and provides honest, deployment-realistic accuracy estimates.
Full Results Table
| Iter | Features | Best Model | Test Acc | Test LogLoss | WF Best | WF Edge | 95% CI | Rank Baseline | Notes |
|---|---|---|---|---|---|---|---|---|---|
| 1 | 15 | XGBoost | 59.39% | 0.7051 | - | - | - | 61.21% (static) | Baseline Elo/rank/form/H2H |
| 2 | 51 | LogisticRegression | 58.79% | 0.6847 | - | - | - | 60.91% (static) | Added player stats, roster, rest days |
| 3 | 51 | XGB_tuned_lean | 60.30% | 0.6850 | - | - | - | 60.91% (static) | Lean feature set + XGB grid search |
| 5 | 56 | LR_L1_C0.01 | 63.33% | 0.6611 | - | - | - | 60.91% (static) | Heavy regularization |
| 7 | 64 | LR_minimal | 66.58% | 0.6056 | 61.02% | +1.68% | - | 59.34% (WF dyn) | 6K matches, scaler leak fix |
| 8 | 72 | XGB_lean | 65.00% | 0.6252 | 60.36% | -0.16% | - | 60.52% (WF dyn) | Dynamic ranks + map features |
| 10 | 75 | XGB_tuned_lean | 64.17% | 0.6275 | 62.55% | +2.60% | - | 59.95% (WF dyn) | Deeper trees, multi-model WF |
| 11 | 82 | XGB_tuned_lean | 64.17% | 0.6262 | 63.23% | +3.27% | - | 59.95% (WF dyn) | Rank volatility + upset detector |
| 13 | 83 | XGB_lean_d15 | 65.00% | 0.7208 | 63.50% | +3.55% | - | 59.95% (WF dyn) | Pistol round win rate feature |
| 14 | 83 | XGB_tuned_lean | 66.50% | 0.6105 | 64.86% | +4.91% | - | 59.95% (WF dyn) | Full player data (94% coverage) |
| 15 | 83 | XGB_tuned_lean | 66.50% | 0.6105 | 65.50% | +5.55% | - | 59.95% (WF dyn) | Fuzzy SVM breakthrough |
| 16 | 83 | XGB_tuned_lean | 66.50% | 0.6105 | 65.50% | +5.55% | [63.5, 67.5] | 59.95% (WF dyn) | Overfit diagnostics |
| 18 | 84 | XGB_tuned_lean | 66.58% | 0.6102 | 65.55% | +5.60% | [63.6, 67.6] | 59.95% (WF dyn) | Tier weighting (reverted) |
| 19 | 83 | XGB_tuned_lean | 66.50% | 0.6105 | 65.50% | +5.55% | [63.5, 67.5] | 59.95% (WF dyn) | Agree-boost ensemble |
Walk-Forward Ensemble Progression
| Iter | Best Ensemble | WF Acc | WF Edge | 95% CI |
|---|---|---|---|---|
| 10 | Ens_rank_blend_a0.2 | 63.05% | +3.10% | - |
| 11 | Ens_rank_blend_a0.1 | 64.36% | +4.41% | - |
| 14 | Ens_rank_blend_a0.1 | 65.36% | +5.41% | - |
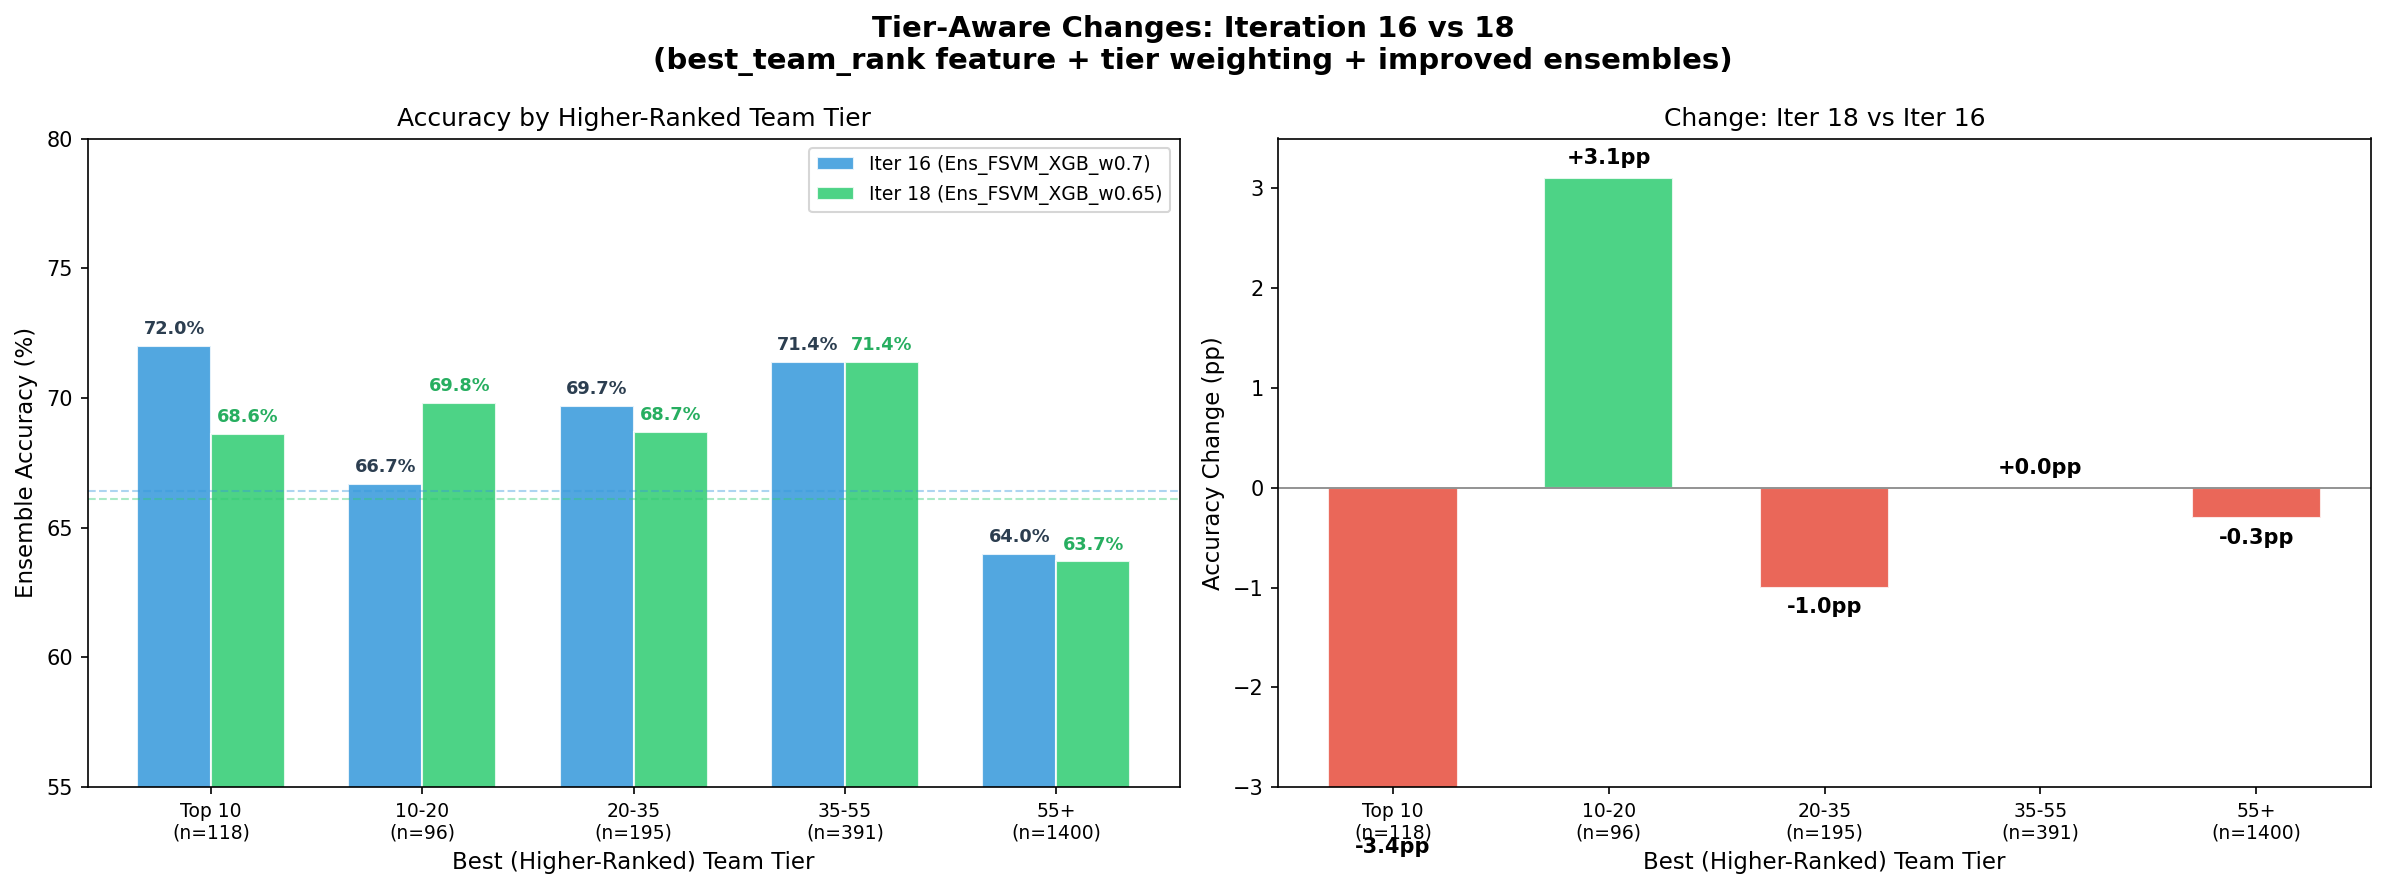
| 15 | Ens_FSVM_XGB_w0.7 | 66.36% | +6.41% | [64.4, 68.3] |
| 18 | Ens_FSVM_XGB_w0.65 | 66.05% | +6.10% | [64.0, 68.0] |
| 19 | Ens_agree_boost_w0.7 | 66.50% | +6.55% | [64.5, 68.5] |
The ensemble progression tells a clear story: rank-based blending carried performance from Iterations 10-14, but the FSVM/XGB probability blend in Iteration 15 was the breakthrough (+1.00pp over previous best). The agreement-boost refinement in Iteration 19 added another +0.14pp by learning when to trust the models jointly versus blending.
Overfit Diagnostics (Iteration 16)
A critical question: are these results real, or are we overfitting? The table below provides the answer.
| Model | Train Acc | WF Acc | Train-WF Gap | Window Std | 95% CI | SV Ratio | vs Rank CI |
|---|---|---|---|---|---|---|---|
| XGB_tuned_lean | 63.11% | 64.86% | -1.75% | 3.85% | [62.9, 66.9] | - | SEPARATED (+0.86pp) |
| XGB_lean_d15 | 64.51% | 63.32% | +1.19% | 3.83% | [61.3, 65.3] | - | overlaps |
| LGBM_lean_d6 | 63.02% | 63.73% | -0.71% | 3.00% | [61.8, 65.8] | - | overlaps |
| FSVM_time_lean | 67.35% | 65.50% | +1.85% | 2.14% | [63.5, 67.5] | 81.4% | SEPARATED (+1.50pp) |
| Ens_FSVM_XGB_w0.7 | - | 66.36% | - | - | [64.4, 68.3] | - | SEPARATED (+2.41pp) |
| Rank baseline | - | 59.95% | - | - | [57.9, 62.0] | - | - |
Key findings:
- FSVM is NOT overfit: Train-WF gap of +1.85% is modest, and its window std of 2.14% is the lowest of any model — the most temporally stable predictions.
- XGBoost generalizes well: Negative train-WF gap (-1.75%) means walk-forward accuracy exceeds training accuracy.
- The ensemble is statistically significant: CI lower bound (64.4%) is 2.41pp above the rank baseline CI upper bound (62.0%). This is not chance.
- Deeper trees don't generalize: XGB_lean_d15 and LGBM_lean_d6 CIs overlap with the rank baseline — their test-set gains are illusory.
- FSVM's 81.4% support vector ratio is high but expected for RBF kernels on noisy data. The kernel implicitly regularizes via the margin, and time-decay membership further down-weights older noisy samples.
Tier-Level Performance
Model accuracy varies significantly by competitive level:
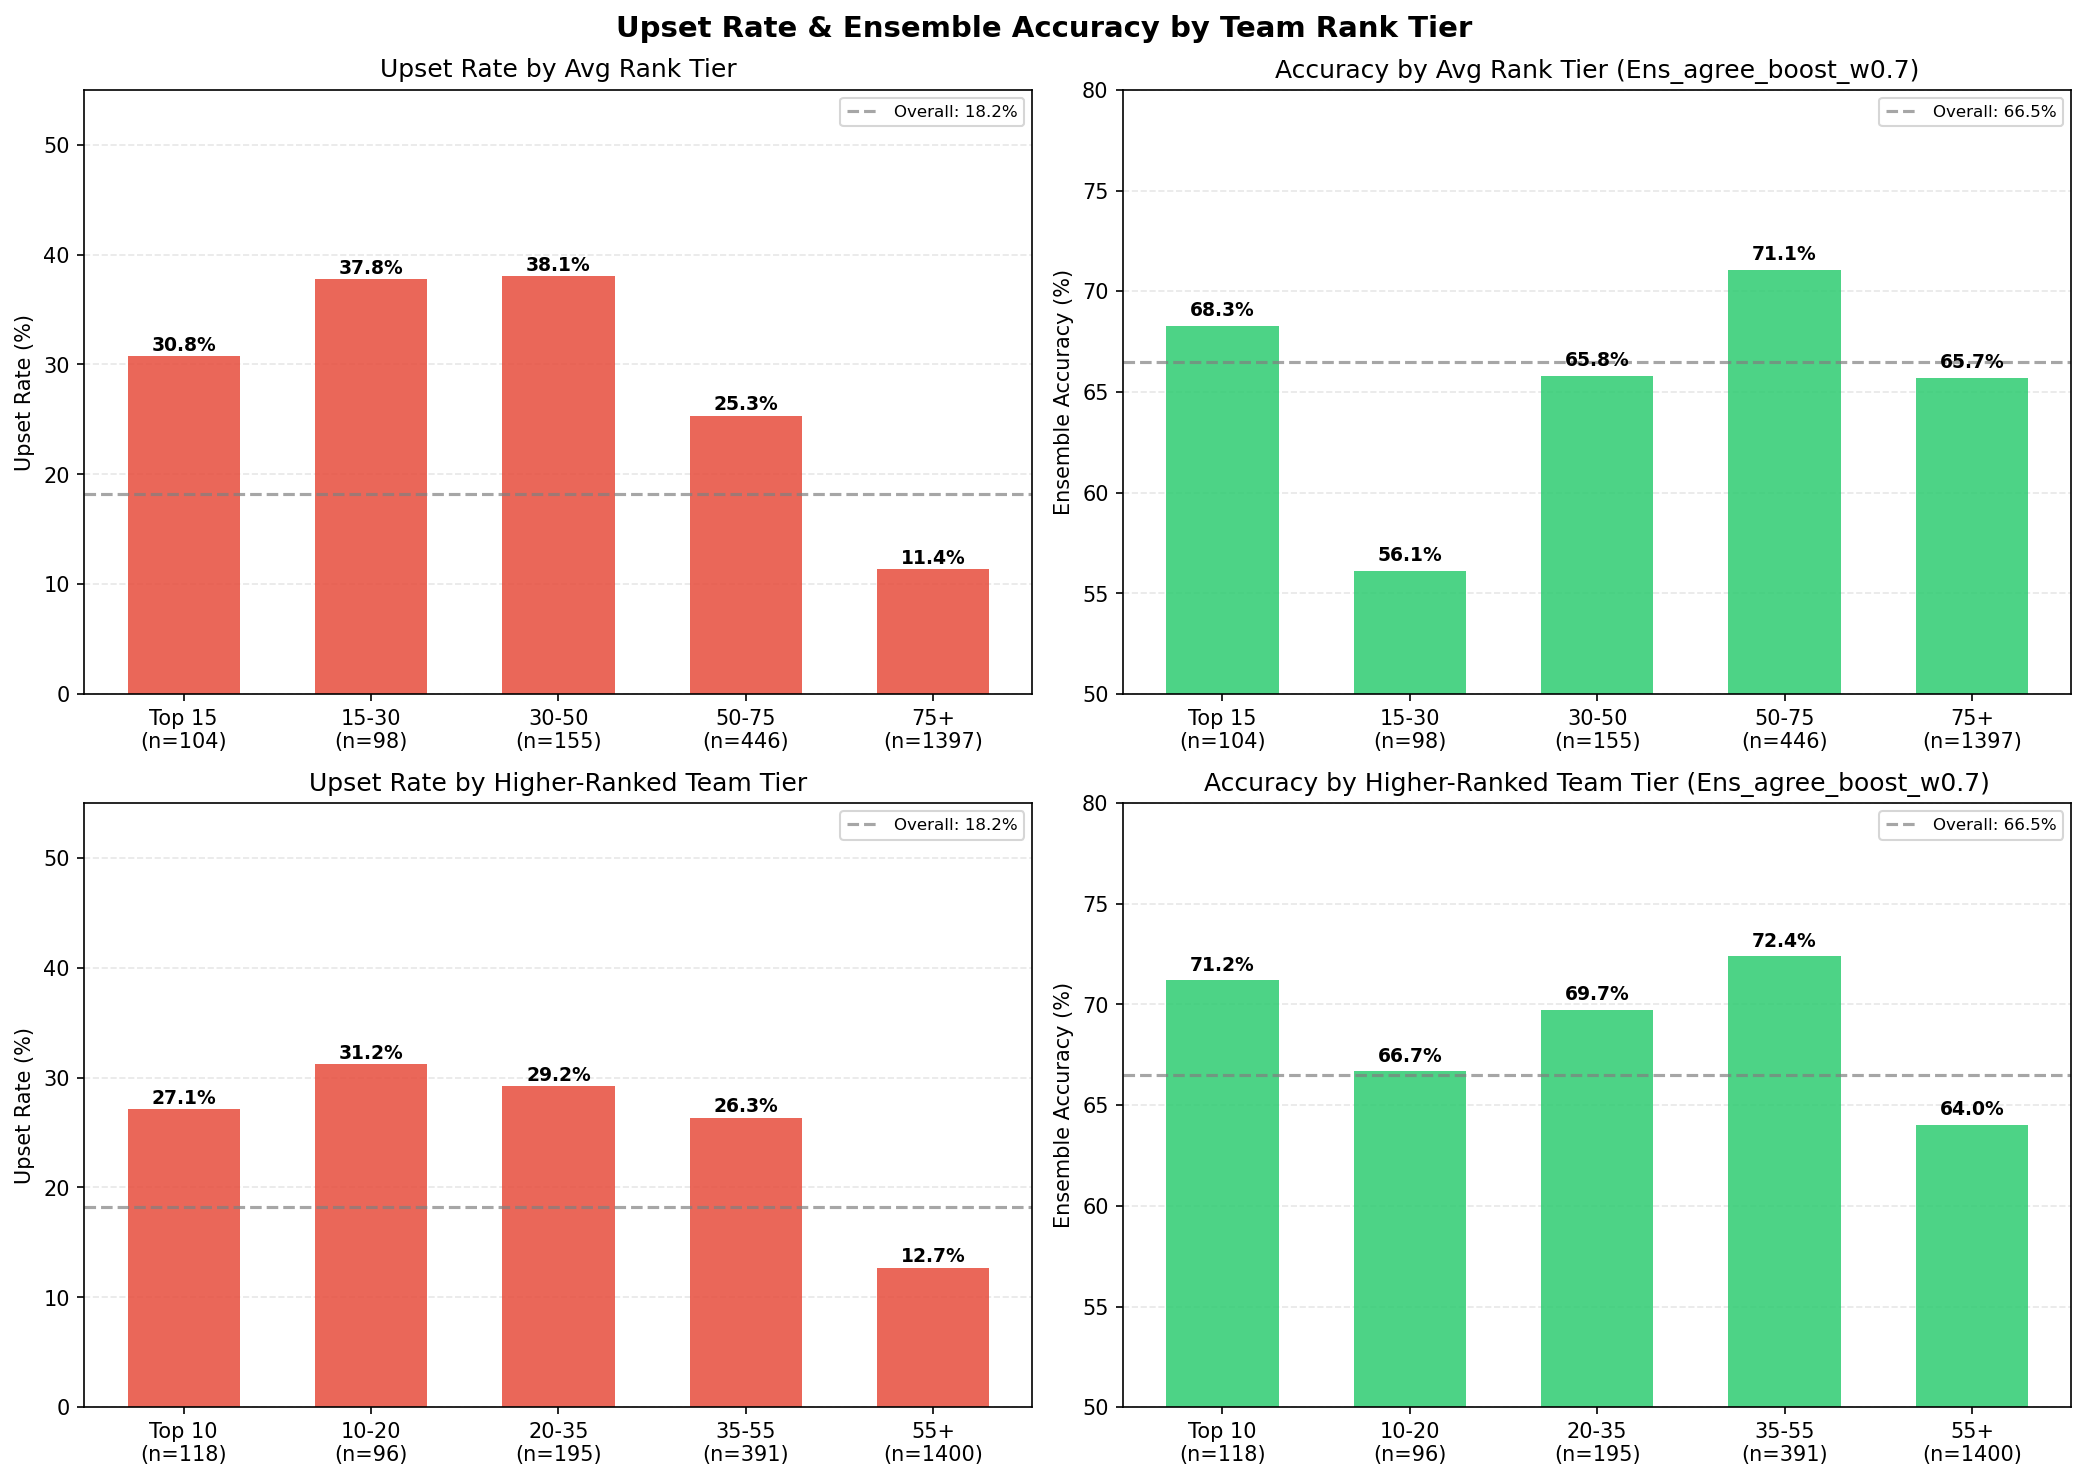
| Tier | Matches | Ensemble Accuracy |
|---|---|---|
| Top 10 | 118 | 71.2% |
| Rank 10-20 | 96 | 66.7% |
| Rank 20-35 | 195 | 69.7% |
| Rank 35-55 | 391 | 72.4% |
| Rank 55+ | 1,400 | 64.0% |
| Elite combined (rank < 55) | 800 | 70.9% |
The model performs best on elite matches (rank < 55) at 70.9% — where team form, player skill, and map pool data are richest and most predictive. The Rank 35-55 tier actually outperforms Top 10, possibly because mid-tier teams have more predictable patterns and fewer meta-breaking roster changes.
Tier-Specialized Models (Iteration 19)
An attempt to exploit these tier differences by training separate models per tier:
| Model | All Samples | Own Tier | N (own tier) |
|---|---|---|---|
| FSVM_elite (rank < 55) | 65.82% | 70.00% | 800 |
| XGB_elite (rank < 55) | 62.09% | 66.87% | 800 |
| FSVM_lower (rank >= 55) | 63.05% | 63.14% | 1,400 |
| XGB_lower (rank >= 55) | 62.68% | 60.00% | 1,400 |
| Best TierSpec ensemble | 65.59% | - | 2,200 |
FSVM_elite achieves 70.00% accuracy on elite-tier matches alone — a strong signal. But the tier-specialized ensemble (65.59%) fell short of the global ensemble (66.50%). The problem: training on tier subsets reduces data per model (~36% for elite), hurting generalization despite better tier-specific fit. The global model with implicit tier awareness (via rank features and interactions) outperforms explicit tier splitting.
Note on tiered model for future research:
That being said this ought to be explored in future iterations - we can train using flexible and overlapping tier bands (since the teams move across the tiers over time regardless), to expand the data set in a way that's feasible. For the time being - we leave the fixed band approach for later.
Key Findings
-
Fuzzy SVM's time-decay membership is uniquely suited to esports — the competitive landscape shifts faster than traditional sports, making recency weighting critical. FSVM showed the lowest temporal variance (2.14% window std) of all models tested, and its formulation directly addresses the problem of older, less-relevant training data polluting the decision boundary.
-
Player-level data was the single biggest unlock — expanding from 27% to 94% coverage produced a +1.36pp walk-forward lift (Iteration 14), the largest single-iteration gain. Roster experience and team chemistry went from invisible to top SHAP features overnight. The same mathematical features went from noise to signal simply through data completeness.
-
Ensemble complementarity is real and measurable — FSVM dominates on expected outcomes (80% accuracy), XGBoost dominates on upsets (40.6%). These are not slightly different models — they have fundamentally different error modes, which is exactly what makes their combination powerful. When they agree (79.5% of matches), accuracy reaches 75.4%.
-
The ~39% upset rate sets a hard ceiling — any rank-aware predictor is bounded at ~61%. The 66.50% result represents a +6.55% edge over this ceiling, capturing most of the exploitable structure in the available feature space. The remaining 3.5pp to the 70% target likely requires fundamentally new data sources (demo reviews, in-game economy data, real-time player communication patterns).
-
Tier-specialized models are a data trap — training separate models for elite vs. lower-tier matches reduces training data per model, hurting generalization. A global ensemble with implicit tier awareness (via rank features) outperforms explicit tier splitting. However, the 70% accuracy on elite matches represents a strong signal for tier-aware betting strategies (i.e., using a single global model but only acting on its predictions for elite-tier matches).
-
Deeper trees overfit temporally — deeper XGBoost variants (d10, d15, d20) improve test-split accuracy by up to +1.83pp but provide negligible walk-forward improvement. They memorize temporal patterns in the training window that don't persist forward. Walk-forward validation is essential for honest evaluation; test-split results are misleading.
-
Simple beats complex — until it doesn't — Logistic Regression with 9 features outperformed all models through Iteration 7. It wasn't until Iteration 10+ that XGBoost with richer features began to consistently beat both LR and the rank baseline in walk-forward. The lesson: added complexity only pays off once data richness and feature quality cross a threshold.
Future Work
- Live odds integration: Real-time bookmaker odds for automated edge detection and Kelly criterion bet sizing
- Demo/VOD analysis: Extract round-level economy and utility usage patterns from game replays
- Transfer learning: Pre-train on CS:GO historical data (10+ years of matches) and fine-tune on CS2
- Real-time tracker updates: Stream match results into the tracker state without full replay (~60s startup)
- Temporal ensemble weighting: Dynamically adjust the FSVM/XGB blend ratio based on recent model performance windows
Built with Python, scikit-learn, XGBoost, and an unhealthy amount of HLTV scraping.